May 22, 2026
What App Instability Actually Costs You (And How to Calculate It)
By Rusty Davis
A one-hour outage at a mid-size SaaS company costs far more than most expect. The direct revenue loss is just the start. Here is how to put real numbers on app instability, and why fixing it pays off faster than most think.
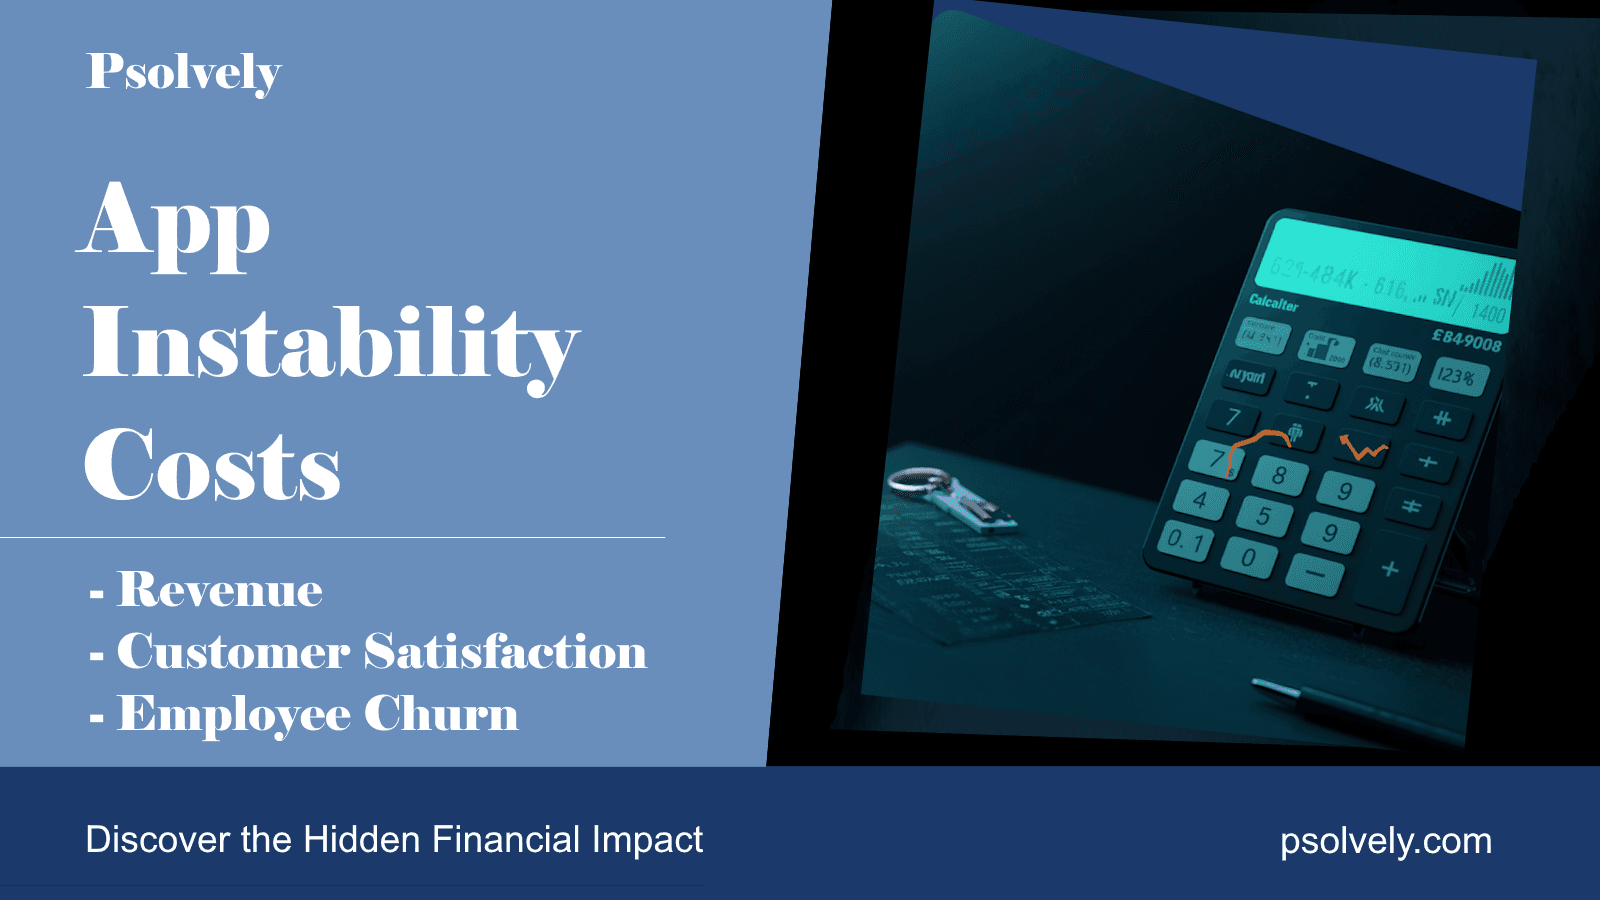
What App Instability Actually Costs You (And How to Calculate It)
Most teams underestimate what app instability costs. The direct revenue loss is only the start.
The average cost of IT downtime is $5,600 per minute for enterprises, according to Gartner research. For mid-size SaaS companies in the $5M to $50M ARR range, the direct cost per hour of unplanned downtime is $10,000 to $100,000. This includes lost revenue, engineering response, and customer impact.
If your system had a two-hour outage last quarter, you spent in this range. If it was caused by a recurring issue, you will spend it again.
But direct revenue is the easy part. The real cost is much higher.
Direct Revenue Loss: The Number Everyone Calculates (But Underestimates)
Step 1: Revenue per hour For SaaS: Annual Recurring Revenue divided by 8,760 hours.
- $10M ARR: about $1,140 per hour
- $25M ARR: about $2,855 per hour
- $50M ARR: about $5,710 per hour
This is your floor. It goes to zero during an outage.
Step 2: Multiply by incident frequency Legacy systems often see 4 to 12 hours of downtime per year, spread across incidents.
- $10M ARR, 8 hours downtime: $9,120 lost revenue. Sounds manageable. It is not the real number.
Step 3: Add the multipliers
- Customer credits and SLA penalties (10 to 30 percent of monthly contract value per incident)
- Emergency engineering cost (team hours, context switches)
- Support burden (tickets, follow-up)
Now a 2-hour outage at a $10M ARR company is $15,000 to $30,000 per event, not $2,280. Four events per year: $60,000 to $120,000. Still not the biggest number.
Hidden Cost #1: Engineering Time as a Capital Drain
For a 10-person engineering team:
- Maintenance: 40 percent of time
- Incident response: 15 percent
- Technical debt: 20 percent
That is 75 percent of capacity lost. At $175K per engineer, 10 people cost $1.75M per year. If 75 percent goes to maintenance and incidents, only $437,500 is spent on progress.
Run a two-week time audit. Ask every engineer to tag hours: feature work, maintenance, incidents, technical debt. Most teams find the results uncomfortable, but accurate.
Hidden Cost #2: The Sales Cycle Impact
Enterprise buyers ask about uptime and security. A fragile system can kill deals. Delay or lose two $120K deals per year, and that is $240K lost ARR.
Instability also shows up in demos and sales calls. An outage during a prospect's evaluation often means a lost deal.
Hidden Cost #3: Churn Accelerator
Incidents drive churn. Customers do not always say it. Trust erodes. One incident may be forgiven. Two and they look elsewhere. Three and renewals are harder.
If 10 percent annual churn is normal and instability is 20 percent of it, at $10M ARR that is $200K lost to instability.
Hidden Cost #4: Morale and Retention
Losing a senior engineer is expensive:
- Recruiting: $15,000 to $40,000
- Lost productivity for three months: about $43,750
- Onboarding ramp: 3 to 6 months
- Knowledge loss: hard to price, but real
Total cost: $100,000 to $200,000 per senior engineer lost. High on-call and maintenance loads drive higher turnover.
The Compounding Effect
These costs get worse every year. Complexity grows. Talent leaves. Security risk grows. For every year you delay fixing instability, add 15 to 25 percent to each cost.
A Cost-of-Inaction Framework
| Cost Category | How to Calculate | |---|---| | Direct revenue loss | (ARR divided by 8,760) times annual downtime hours | | SLA credits | Incidents times average credit value | | Engineering waste | Team payroll times percent on maintenance | | Incident overhead | Incidents times average incident cost | | Sales impact | Lost/delayed deals times ACV | | Churn | Instability-driven churn times ARR | | Turnover | Annual engineering turnover times $150K | | Total annual cost | Add all above |
Now compare to the cost of a stabilization engagement. Most mid-size companies spend 20 to 40 percent as much to fix the problem as they lose each year by ignoring it. Payback is usually in months.
What Stabilization Returns
When instability is fixed at the root, teams see:
- 60 to 80 percent fewer incidents in 90 days
- Engineering time recovered (like adding headcount, no hiring needed)
- Faster feature delivery (6 weeks to 3)
- Better retention and hiring
The Psolvely Stabilization Approach
We work with engineering teams ready to reduce instability costs.
Our stabilization engagements run 4 to 8 weeks. First, we diagnose your incident history and team capacity. Then we fix the highest-leverage problems. We do not sell long programs. We deliver measurable results in a set timeframe and give a clear plan for next steps.
If your cost of instability is high, let us show you what a targeted engagement looks like.
Book a free discovery call at psolvely.com. Thirty minutes, no pitch deck. Just an honest conversation about your situation.
psolvely.com
Want to work together?
Book a 45-minute strategy session and leave with a concrete plan.
Book a Strategy Session
Get the FREE Legacy Modernization Playbook
Ask me anything about modernizing your system and I'll personally reply — your playbook lands in your inbox the moment you hit send.